Visualizing and Clustering NASA Exoplanet Data
This project marks the beginning of my new personal website. Learning is eternal: hoping to document some of that journey here. This first project was created out of my interest in astronomy and the perpetual goal of honing my skills in data science.
This project peers into exoplanet science through the lens of data. I grab a dataset from the NASA exoplanets archive on which I'll explore, visualize and perform unsupervised learning through a -means clustering algorithm.
Project summary
| Project Goals | Query and clean data from NASA exoplanet archive; perform exploratory data analysis and visualize planet features; and employ -means clustering comparing groups to existing exoplanet classifications. |
|---|---|
| Languages | Python (pandas, numpy, matplotlib, seaborn, scikit-learn), SQL (one humble query) |
| Techniques and skills | Data querying, data cleaning, missing value detection, outlier handling, visualization, machine learning, unsupervised learning, -means clustering |
| Project GitHub | GitHub Repo - exoplanet-viz-cluster |
Background
Our popular conception of space is dominated by stars. Understandably though. Not to get poetic, but for as long there's been life on Earth, we've gazed at the night sky. Planets, on the other hand, just don't get the same notoriety. While we're accustomed to the nine in our Solar System (well, eight since the Pluto debacle), exoplanets - planets outside our Solar System - don't enjoy the same level of recognition
I'd argue that this view is changing, though. Most astronomers recognize an invaluable prospect that exoplanet science offers - confirming the existence of extraterrestrial life. In fact physicists claim that we're guaranteed to find life beyond our Solar System given enough searching and the genuine unlikelihood that life on Earth is unique.
This project investigates the existing record on exoplanets. I'll perform exploratory data analysis on exoplanet data provided by NASA. I will then visualize this data with the goal of rendering big picture takeaways. Lastly I'll conduct unsupervised machine learning using a -means clustering algorithm on the data and compare it to existing exoplanet classifications. For the full technical process consult my GitHub repository.
Data collection and cleaning
I will work with the Planetary Systems dataset, which contains records of all 5638 confirmed exoplanets, provided by the NASA exoplanets archive. The archive is a collaboration between Caltech and NASA under its Exoplanet Exploration Program.
I’ve grabbed planet radius, planet mass, distance from Earth, discovery method and discovery year as parameters of interest.
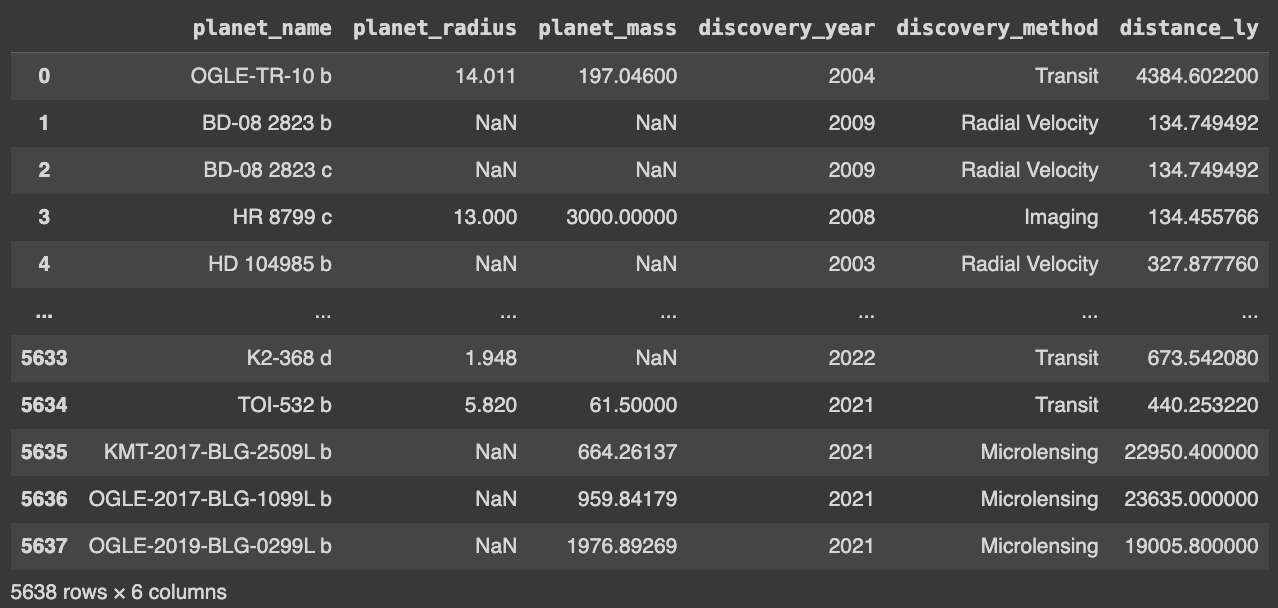
I’ve queried this data from NASA’s Table Access Protocol (TAP) using SQL and Python’s requests package and conducted some basic pre-processing. A quick peek at the data gives us:
Here’s a more comprehensive summary of the data, including counts of each feature (counts below 5638 indicate missing data), minimum and maximum values, and 25th, 50th and 75th percentiles:

Observation(s):
- Exoplanet science is young - the first exoplanet was found in 1992. Interestingly though, only the researchers behind an exoplanet discovery three years later would snatch a Nobel Prize (it's always political).
- There is a surreal amount of diversity in planet characteristics - these range from
- 4 to 25,000 light years away
- 0.4 to 10,000 times Earth's mass (M⊕)
- 0.3 to 77.3 times Earth's radius (R⊕)
With this first glimpse let’s dive in deeper with visualizations.
Visualization and Analysis
Next I’ll visualize the data. I’ll only be showing outputs created using matplotlib and seaborn. I wanted to challenge the notion that these packages lack in complexity or aesthetic quality by developing graphs that still feel dynamic, and employing lesser-used tools such as 3D graphs, matplotlib tables and stylesheets.
Discovery method
Since exoplanets are fundamentally harder to detect than other bodies like stars, finding them has required the development of complex methods using fine-grained spectroscopic data:
- The transit method tracks the shift in light as an exoplanet crosses a visible star, creating a "mini-eclipse" with the Earth.
- The radial velocity method tracks shifts in a star's motion due to the gravitational pull of an orbiting exoplanet.
- The microlensing method tracks distortions of light as large exoplanets pass in front of a star.
I've tracked the evolution in exoplanet discoveries since the first in 1992:

- Obvious uptick in findings over the past decade.
- 2016 saw a near-doubling of exoplanets, owed to the Kepler Space Telescope Mission, the most successful exoplanet mission to date.
- Transit method is clearly most successful.
Observational cosmologist Chris Impey observed that the rapid discovery of exoplanets is comparable to the explosive growth of internet technology during the Dotcom bubble. Above that growth is on full display.
Distance from Earth
Next I track exoplanet distance from Earth:

- Clear decrease in exoplanet findings with distance. Unsurprising and likely due to observational limits.
- Highest concentration within the first 2,000 light years.
- Very few exoplanets beyond 6,000 light years, but remarkably a small number of planets accessed beyond 8,000 light years.
I'll also evaluate the planet distribution using a cumulative distribution function, which indicates to us the probability () that an exoplanet will be found at a distance less than or equal to some value () from Earth:

- For example, about 60% of known planets can be found within 2,000 light years from Earth.
- About 90% of exoplanets exist within the 10,000 light year range.
- Growth slows down past 4,000 light years.
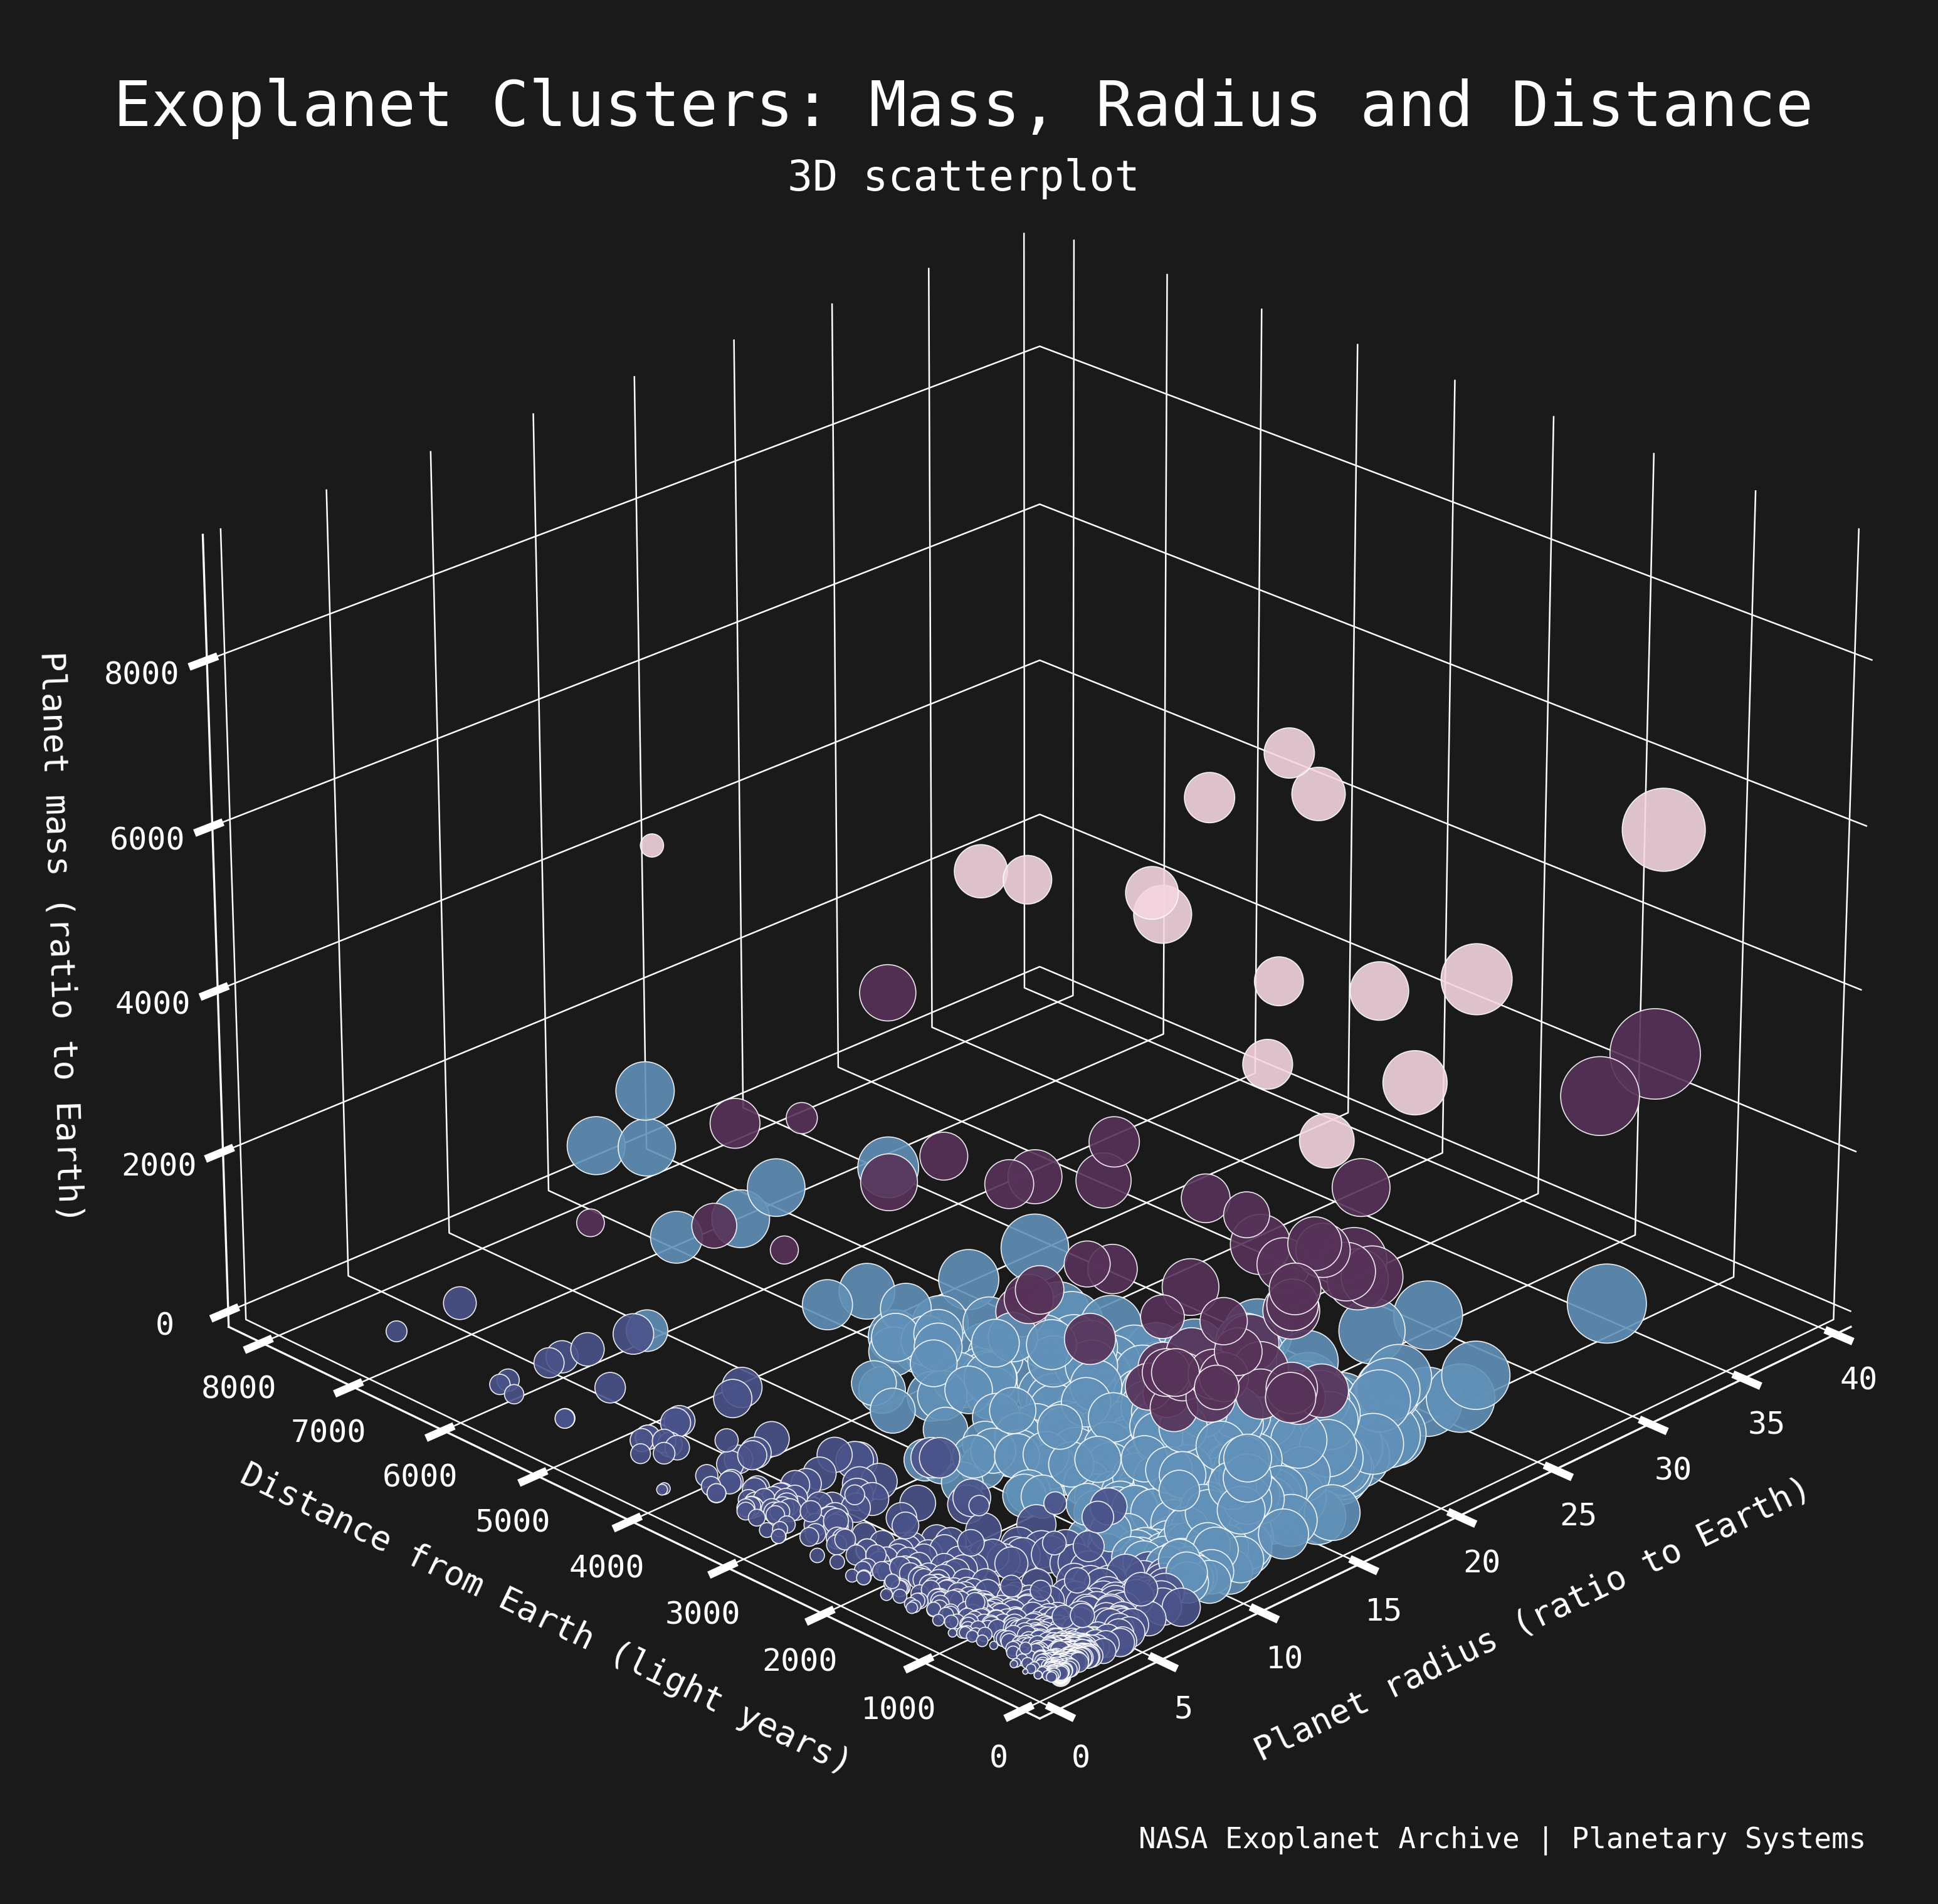
Planet mass and radius
Now I'll track radius and mass with a scatterplot, where each dot is an exoplanet. Note that mass () is on a logarithmic scale and also described with color:

- Apparent linear relationship between of planet mass and planet radius.
- Two major groups: smaller vs. moderate radius and mass
- A few outliers with very large mass and radii.
These graphs have given us a fairly good sense of the ensemble based on what I've grabbed. The exploration could be endless of course, but I'll now shift to the machine learning portion.
Machine Learning Classification
With some greater insight under our belt, I'll apply a machine learning model to our data, categorizing them into distinct groups using clustering.
Various categorizations have been created by astronomers since the first exoplanet discovery in 1992. When considering size, for instance, we often hear of these widely-used classifications:
- Super-Earths (1.0–1.75 R⊕) - Planets larger than Earth
- Sub-Neptunes (1.75–3.5 R⊕) - Planets smaller than Neptune
- Sub-Jovians (3.5–6.0 R⊕) - Planets smaller than Jupiter
- Jovians (6–14.3 R⊕) - Planets near Jupiter's size
For my machine learning applications, I aim to replicate these classifications using our exoplanet data. This involves unsupervised learning, where the model doesn't rely on labeled training data for the classifications we're trying to create.
I'll employ a -means clustering algorithm, which for any number groups the data based on select features - in this case, mass and radius - and returns clusters based on their similarities. I'll do this using scikit-learn. I won't touch on the complexities of the algorithm itself here.
Silhouette Score calculation
I'll use the Silhouette Score Method to determine the number of categories (clusters) that's best to model. This method tests the algorithm on different groupings (one group, two groups,...) and attributes to each a score based on how well the algorithm will generate members that are alike. High scores indicate good grouping results, low scores indicate ineffective groupings.

- Clearly, the most favorable score is four.
Apply -means clustering algorithm
Based on the Silhouette Method, I ran a -means model on the exoplanet data generating four clusters.
Here's a scatterplot displaying the results. Colors represent different clusters, centroids (+) represent the mean values of each cluster.

- Clusters 1 and 2 appear to be well categorized, representing planets with small radius/mass and medium radius/mass, respectively.
- Clusters 3 and 4 are in the similar vicinity but span very wide ranges of radius, which could be suspect.
- No strong correlation between mass/radius and distance. Expected - we wouldn't expect planet characteristics to depend on their distance from Earth.
Cluster Analysis
Let's look closer at each group and how each cluster fares to existing exoplanet groupings:Cluster 1
Smaller planets

These likely contain:
- Super-Earths, 1-10 times M⊕.
- Sub-Neptune, less than 3.88 times R⊕ (Neptune's radius).
- Super-Neptune 2-6 times R⊕ and 10-50 times M⊕.
Cluster 2
Medium-sized planets

These likely contain:
- Super Jupiters: over 318 times M⊕ (1.5 times Jupiter mass).
- Super Neptunes: 10-20 times M⊕.
- Jovians 6–14.3 times R⊕
This is the largest cluster. It's also the cluster with the smallest spread of values. Relatively few outliers.
Cluster 3
Large and massive planets

These likely contain:
- Super-Jupiters given their clear superior size to Jupiter.
- Brown-Dwarfs, whose tend to have a mass-to-Earth ratio between 4,000 to 25,000. In fact, the the entire cluster falls in this regime.
Brown dwarfs are fascinating because they lie in an area of classification between planets and stars, exhibiting properties of both. Usually they're born like stars, but fail to sustain the nuclear fusion of hydrogen; whether they're 'proper' planets is a matter of debate.
Cluster 4
Also large and massive planets

Most likely these contain:
- Super-Jupiters given their clear superior size to Jupiter.
Having considered each cluster, some reflections:
- Some relevant patterns, no neat classifications - Aside from the very-large brown dwarfs, no cluster was a perfect category.
- Clustering could have benefited from more features - Adding features like orbitals or host star characteristics could have siphoned off clearer groups.
- Clustering is difficult for badly defined categories - We could have difficulty because of flaws inherent in exoplanet characterization.
Expanding on this, it's clear that we tend to designate mass and radius-based categorizations of planets based on our own Solar System rather than the fundamental qualities of planets. It's essentially a form of heliocentrism. What differentiates a Sub-Neptune and a Super-Neptune aside from their size relative to Neptune? Categorizing planets thousands of light years away in this matter could be argued as unscientific.
The ramifications of bad groupings is that a machine learning classification algorithm may struggle to accurately categorize groups when the categories themselves are not based on the fundamental characteristics of the members. I do believe that this is most likely what's occurred here and for that reason there's a threshold to the success that can be achieved using this approach.
Closing thoughts
I think that the thrill with data visualization in particular is being able to take complexity and deliver insights that are tangible, and hopefully stimulate curiosity in people they didn't know they had. Obviously it just scratched the surface, but this work challenged me to reflect on representing a scientific domain through data science in a way that felt compelling.
As data scientists we tend to get enthralled in the complexity of our work, and sometimes forget the power that lies in the bridges of communication we're able to create with our skills. This project allowed me to tap into this practice.
I believe that the machine learning portion could have explored other categorization methods or gone into more depth, but I also think that the categorization issue from the end is limiting. What consists in a good categorization becomes subjective at a certain point.
Resources
If worked has piqued your interest on exoplanet science, here are a few resources I've enjoyed in creating this project:- Discovery of 69 New Exoplanets Using Machine Learning - Incredible usage of a deep learning algorithm called ExoMiner and the technique of multiplicity to identify new planets.
- China's Ambitious Plan to Find the First Earth 2.0 - A look into China's efforts to launch a new telescope in 2026 that will devote itself to finding a habitable Earth-like exoplanet.
- Webb's Impact on Exoplanet Research - Dives in to the to-be-seen impact of the James Webb Space Telescope on exoplanet science, which introduced novel exoplanet detection techniques into the fold.
- Explore exoplanets: The knowledge server - Exoplanets - A very complete and rich EU-based exoplanet learning hub.
- Beautiful Tables in Matplotlib, a Tutorial and How to create custom tables - Great tutorials on creating custom tables.
- Customizing Matplotlib with style sheets and rcParams - Comprehensive from-the-source demo on customizing Matplotlib style.
- Viz Palette - Outstanding and flexible palette tool to pick and test out your color schemes.
- Lollipop chart | The Python Graph Gallery - Short intro to lollipop plots. Smart barplot alternative to avoid Moiré patterns.